
Pipeline Coverage Ratio: How to Calculate It and What Good Looks Like

Sarah Johnson
Writes about field sales, meeting notes and voice-first workflows at ParrotNotes. Every article is reviewed by the ParrotNotes product team before it goes live.

Table of Contents
- 1.What is a pipeline coverage ratio?
- 2.How to calculate pipeline coverage ratio in four steps
- 3.Why the 3x rule depends on win rate and cycle length
- 4.Stage-weighted pipeline coverage
- 5.What is a good pipeline coverage ratio?
- 6.When to measure pipeline coverage
- 7.How to fix low pipeline coverage
- 8.A pipeline coverage worksheet
- 9.Pipeline coverage ratio: the short version
Three weeks into the quarter, Priya's dashboard said 3.0x. Her eight-person field team had $2.7 million of open pipeline due this quarter against $900,000 of quota still to close.
Every sales book she'd read said three times was safe. Then she did the math with her own win rate and slippage. She needed 5x. (Priya and her team are an illustrative example, not real people.)
Most sales leaders already track a pipeline coverage ratio, and most suspect the "3x" target is too tidy. They're right. The number you need depends on your win rate, how often deals slip and how long your sales cycle is.
This guide gives you the formula, a worked example, the math behind the 3x rule (and a table of what to use instead), stage-weighted coverage, named benchmarks and a fix for each cause of low coverage. Coverage is only as good as the deal notes behind it; if your reps would rather talk than type, try ParrotNotes free and turn a two-minute debrief after each meeting into a summary with next steps.
What is a pipeline coverage ratio?
A pipeline coverage ratio compares the value of the open, qualified deals due to close in a period with the quota still to close in that period. It answers one question: is there enough pipeline to hit the number?
The pipeline coverage formula:
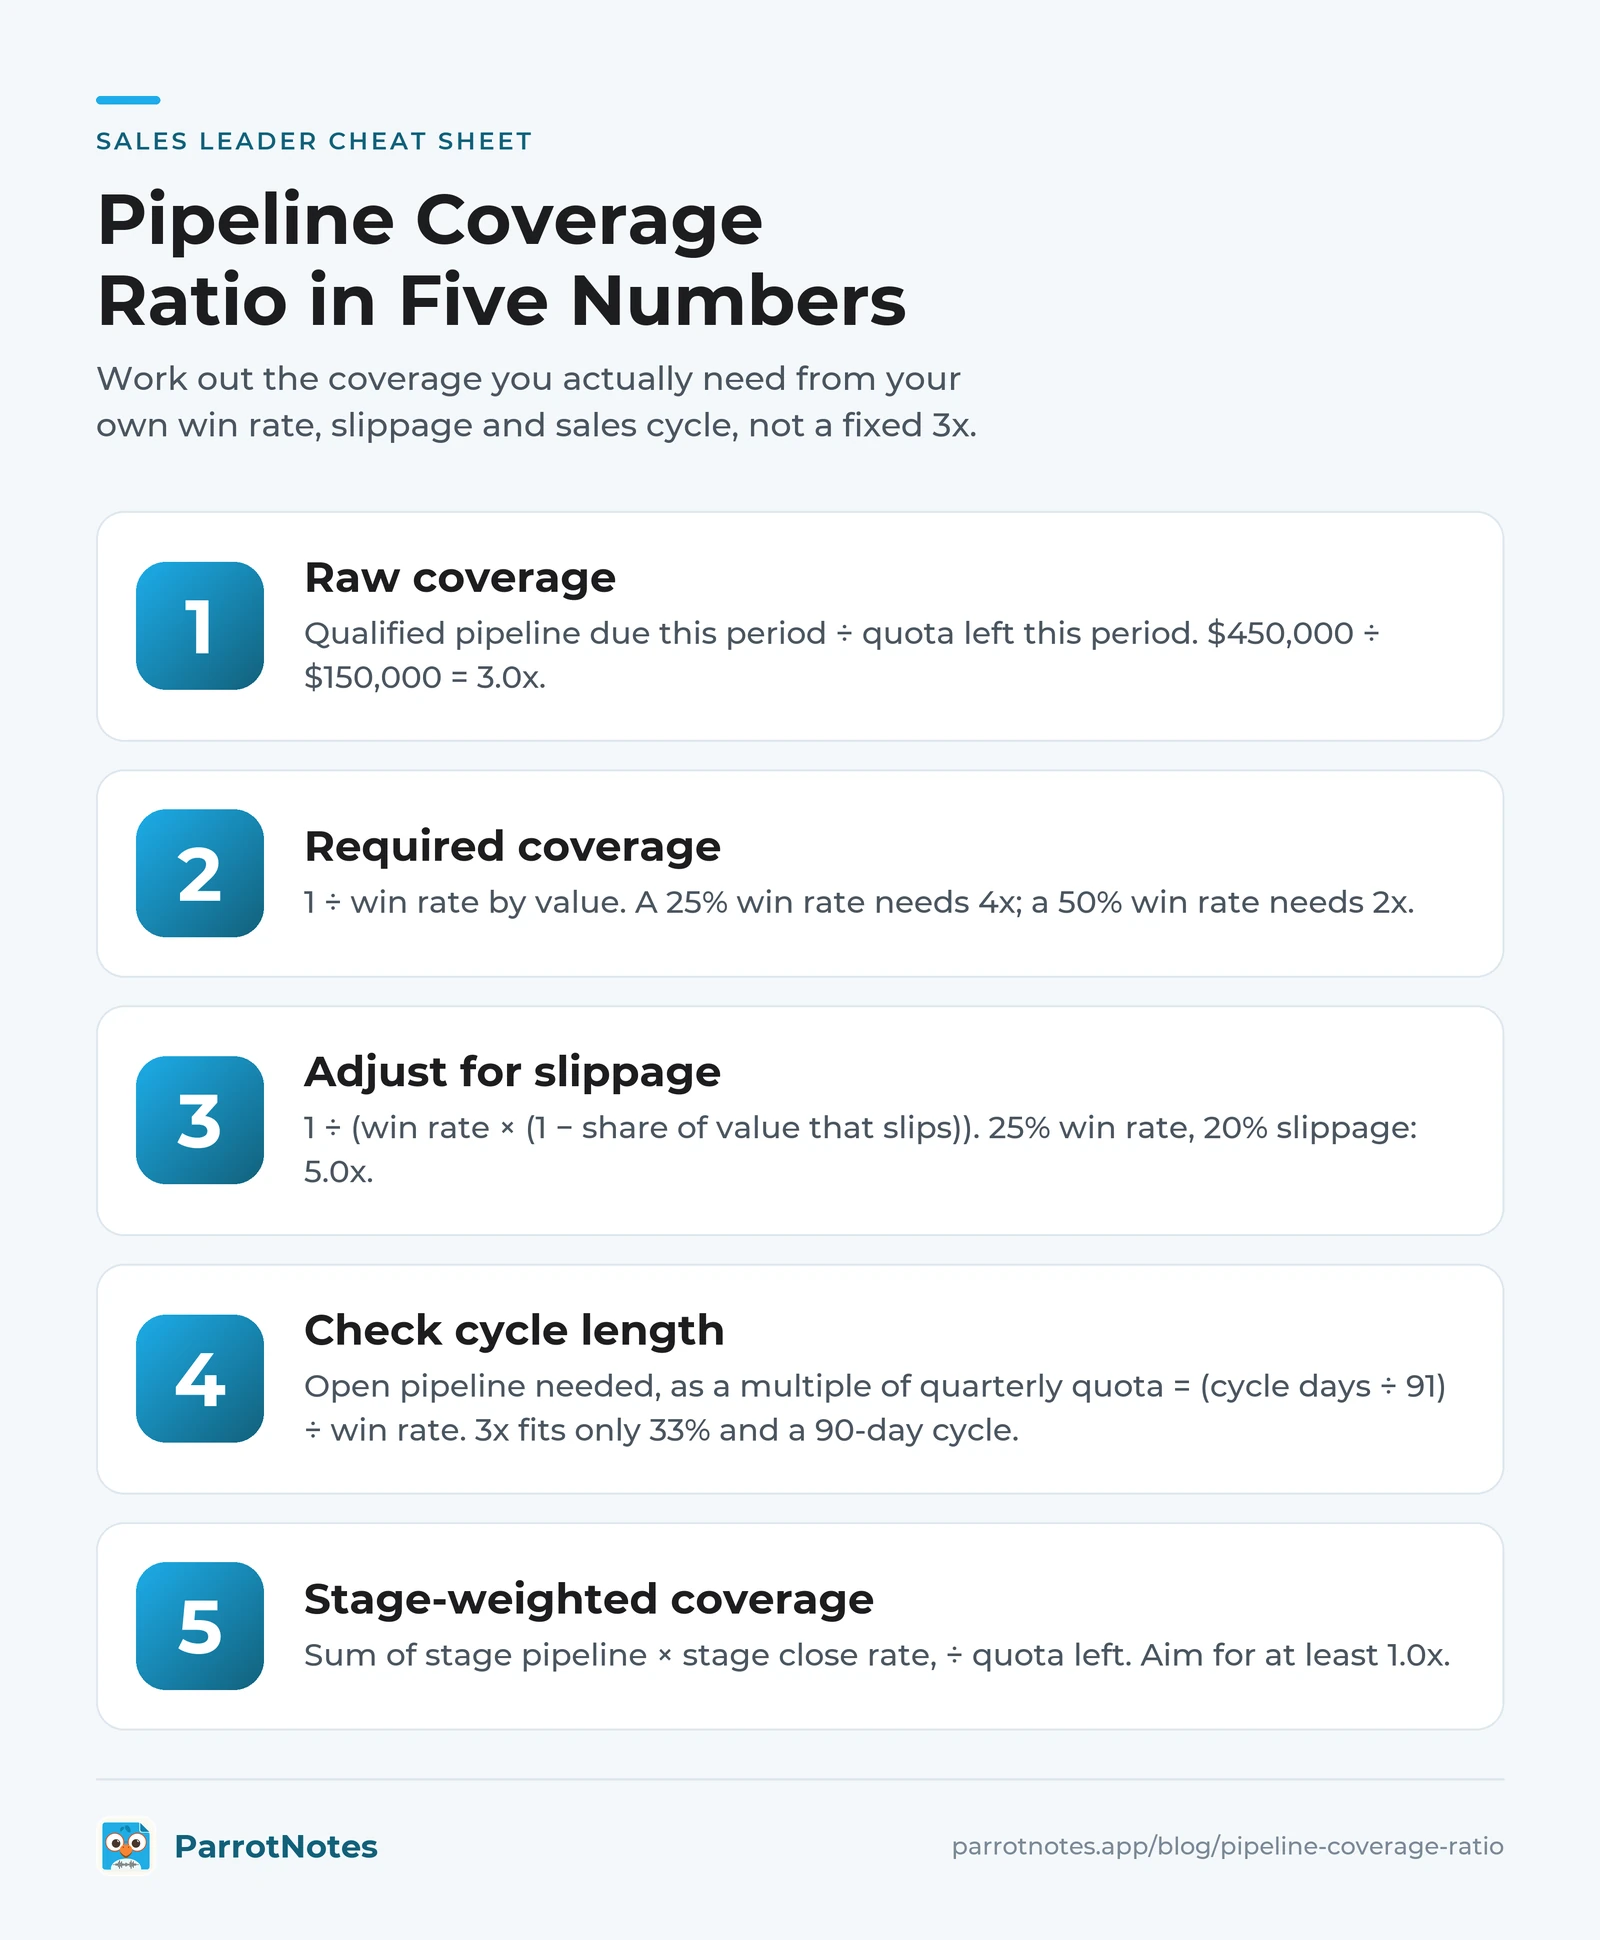
Pipeline coverage ratio = Qualified open pipeline due this period ÷ Quota left this period
So $450,000 of qualified pipeline against $150,000 of quota left is 3.0x coverage. HubSpot's glossary describes the same calculation in its sales pipeline coverage definition.
Coverage is a leading indicator. Forecast accuracy tells you after the quarter whether you called it right; coverage tells you early whether there's enough to work with. For the stages it's built on, see what a sales pipeline is.
How to calculate pipeline coverage ratio in four steps
- Fix the period and the quota left. Use the quarter (or month) you're forecasting, minus what has already closed.
- Count only qualified pipeline due in that period. Include deals whose close date falls inside the period and that pass your hygiene rules. Leave out early leads and deals nobody has spoken to in weeks; our sales pipeline management guide has six rules for this.
- Divide. Pipeline ÷ quota left gives the ratio.
- Compare it with your required coverage, not with 3x. The next section shows how to work that out.
Worked example: Priya's quarter
| Line | Value |
|---|---|
| Quarter quota | $1,200,000 |
| Closed so far (end of week 3) | $300,000 |
| Quota left | $900,000 |
| Qualified pipeline due this quarter | $2,700,000 |
| Pipeline coverage ratio | 3.0x |
On its own, 3.0x tells you nothing. Whether it's healthy depends on the next three numbers.
Why the 3x rule depends on win rate and cycle length
Jason Jordan put it bluntly on the Salesforce blog: the 3x rule "works only when your win rate is exactly 33% and your sales cycle is exactly one year" (Salesforce). Here's the math, one input at a time.
Win rate sets the base
If you win a third of your pipeline by value, you need three dollars of pipeline for every dollar of quota. In general:
Required coverage = 1 ÷ win rate
A 25% win rate needs 4x. A 50% win rate needs 2x. Use win rate by value, measured from the same stage your coverage counts from; a win rate by deal count overstates it when small deals close more often. Our free win rate calculator works it out from your closed deals.
Slippage raises it
Win rate counts deals that close eventually. Coverage asks what closes this quarter. Deals that slip into next quarter don't count, so:
Required coverage = 1 ÷ (win rate × (1 − share of value that slips))
Priya's team wins 25% by value, and about 20% of the value due in a quarter usually slips out of it. That gives 1 ÷ (0.25 × 0.80) = 5.0x required. Her 3.0x covers 60% of what she needs: about $540,000 of expected bookings against $900,000 left.
Slipped deals also get worse with age. Ebsta's H1 2024 B2B Sales Benchmarks found that "win rates decline by 83% when deals slip". That's one more reason to judge every deal by the buyer's date, as our guide to improving sales forecast accuracy explains.
Cycle length decides how much pipeline you need at once
Jordan's formula for the total open pipeline a rep needs at any moment is:
Pipeline needed = Annual quota ÷ win rate ÷ (365 ÷ sales cycle in days)
His example: $100,000 annual quota, 25% win rate and a 60-day cycle need about $65,757 of pipeline. A short cycle turns pipeline over several times a year, so less is needed at once. A long cycle means this quarter's pipeline must carry next quarter's deals too.
Here's that formula turned into a lookup table, built for this article. Each cell is the total open pipeline (all close dates) as a multiple of one quarter's quota:
| Win rate | 30-day cycle | 60-day cycle | 90-day cycle | 180-day cycle |
|---|---|---|---|---|
| 15% | 2.2x | 4.4x | 6.6x | 13.2x |
| 20% | 1.6x | 3.3x | 4.9x | 9.9x |
| 25% | 1.3x | 2.6x | 4.0x | 7.9x |
| 33% | 1.0x | 2.0x | 3.0x | 5.9x |
| 40% | 0.8x | 1.6x | 2.5x | 4.9x |
| 50% | 0.7x | 1.3x | 2.0x | 4.0x |
Multiple = (cycle days ÷ 91) ÷ win rate. A quarter is about 91 days. Add your slippage adjustment on top.
Read it this way: 3x of a quarter's quota is right only at a 33% win rate with a 90-day cycle. That's Jordan's rule seen from a quarter instead of a year.
Take Dev, who runs a six-rep team selling packaging machinery (also illustrative). His cycle is about 180 days, his win rate 33%, his quarterly quota $1 million. His board reads $3.2 million of open pipeline as a healthy 3.2x.
The table says he needs 5.9x, about $5.9 million across this quarter and next. His problem isn't this quarter. It's the one after, and it's already visible. Our guide to the long sales cycle covers how to keep those deals moving.
Stage-weighted pipeline coverage
Raw coverage treats a first meeting and a signed-off proposal as the same dollar. Stage-weighted coverage doesn't. Multiply each stage's pipeline by the share of deals at that stage that historically closed by the end of the same quarter, then add it up:
Weighted coverage = Σ (stage pipeline × stage close rate) ÷ Quota left
The target is at least 1.0x, plus a small buffer. Salesloft calls weighted coverage "the more honest signal" (Salesloft). Here's Priya's pipeline, with illustrative close rates:
| Stage | Pipeline due this quarter | In-quarter close rate | Weighted value |
|---|---|---|---|
| Discovery | $900,000 | 5% | $45,000 |
| Qualified | $700,000 | 15% | $105,000 |
| Proposal | $600,000 | 30% | $180,000 |
| Negotiation | $350,000 | 50% | $175,000 |
| Commit | $150,000 | 80% | $120,000 |
| Total | $2,700,000 | $625,000 |
$625,000 ÷ $900,000 = 0.69x weighted coverage. That's a little kinder than the $540,000 from the win-rate method, because more of her pipeline sits in late stages than usual. Both say the same thing: the team is around $300,000 short.
Weighting only works if stages mean buyer actions, not rep optimism. Our forecast categories guide shows how to keep commit and best case honest. To turn the weighted number into a forecast, try the free sales forecast calculator.
What is a good pipeline coverage ratio?
Published benchmarks cluster around three to five times quota:
- HubSpot: "Most successful sales organizations maintain a coverage ratio of 3:1 to 5:1" (HubSpot).
- Salesloft: "Most B2B teams target a ratio between 3x and 5x", and "Enterprise teams with win rates between 15% and 25% need 4x to 7x coverage."
- Salesforce (Jordan): 3x is right only at a 33% win rate and a cycle that matches the period.
And the stakes are real: Ebsta's H1 2024 update found 75% of reps missed quota.
So a good pipeline coverage ratio isn't one number. It's your required coverage, met on clean pipeline, early enough to act:
- Healthy: at or above 1 ÷ (win rate × (1 − slip share)), and weighted coverage at or above 1.0x
- Watch: within 20% below required
- Short: more than 20% below required, or weighted coverage under 0.8x
- Suspicious: far above required. Very high coverage often means stale deals nobody has closed out
When to measure pipeline coverage
Measure it weekly, by rep and for the team. Team totals hide the rep who is furthest short.
Timing matters as much as the number. Salesloft warns that "coverage reviewed in week 10 of a 13-week quarter doesn't leave enough runway." The cycle-length math tells you exactly when the runway ends: every deal that will close next quarter has to exist one sales cycle before its close date. With a 90-day cycle, next quarter's pipeline should be fully built by the day that quarter starts, and a deal created later has little chance of closing inside it.
That's Priya's real lesson. With 10 weeks left and a 90-day cycle, new prospecting can't save this quarter. She can protect the $500,000 in negotiation and commit and look for short-cycle expansion deals with current customers.
Her bigger job is next quarter: at 5.0x required on a $1.2 million quota, she needs $6 million due next quarter, and she has $2.1 million. That's $3.9 million to create in 10 weeks, about $49,000 per rep per week.
Put coverage on the agenda of every weekly deal review, and look at next quarter, not just this one.
How to fix low pipeline coverage
"Prospect more" is the default answer, and it's only right for one of five causes. Find the cause first:
| Cause | How you spot it | Fix |
|---|---|---|
| Not enough new pipeline | New qualified pipeline per rep per week is falling | Set a weekly creation target per rep from the coverage gap; protect prospecting time |
| Deals too small | Coverage short while deal count is fine | Widen discovery: more sites, users, stakeholders (see average deal size) |
| Deals slipping | Close dates moved more than once; slip share rising | Set close dates from the buyer's plan; review every slipped deal |
| Losing more than usual | Win rate by value dropping | Run a loss review on the last ten losses; tighten qualification |
| Building too late | This quarter fine, next quarter thin | Measure next-quarter coverage weekly from day one of the current quarter |
Then check the opposite problem. Marta (illustrative) had 6.2x, the highest on her team. A Friday hygiene sweep found that 40% of it hadn't heard from a buyer in 45 days.
Her clean coverage was 3.7x against the 4.0x her win rate needed. She wasn't the safest rep; she was slightly short and didn't know it.
All five fixes depend on the same input: an accurate record of what the buyer said and agreed. ParrotNotes helps there.
A rep records a two-minute spoken debrief after each meeting, and gets a transcript, a summary and action items, with BANT, MEDDIC and SPIN frameworks available even on the Free plan's AI recordings. With accurate next steps in the CRM, close dates and stages stop drifting. Download ParrotNotes to try it on your next deal review.
A pipeline coverage worksheet
Copy this into your Monday prep. Fill one per rep and one for the team.
PIPELINE COVERAGE WORKSHEET            Period: __________

1. Quota left this period                  $__________
2. Qualified pipeline due this period      $__________
3. Raw coverage (2 ÷ 1)                    ______x
4. Win rate by value (last 4 quarters)     ______%
5. Share of value that slips               ______%
6. Required coverage 1 ÷ (4 × (1 − 5))     ______x
7. Weighted pipeline (stage × close rate)  $__________
8. Weighted coverage (7 ÷ 1)               ______x   target ≥ 1.0x
9. Next period: pipeline due ÷ quota       ______x   vs required ______x
10. Gap to required (6 × 1 − 2)            $__________
    Main cause (creation / size / slip / losses / timing): ________
Pipeline coverage ratio: the short version
- Formula: qualified pipeline due this period ÷ quota left this period.
- Required coverage: 1 ÷ (win rate × (1 − slip share)), not a fixed 3x.
- Cycle length: the longer the cycle, the more total pipeline you carry and the earlier next quarter's must exist. 3x of a quarter is right only at 33% and about 90 days.
- Weighted coverage: aim for at least 1.0x, with stages tied to buyer actions.
- Fix the cause, not the ratio: creation, deal size, slippage, losses or timing.
Run the worksheet this Monday for each rep, and treat each pipeline coverage ratio as a question, not a grade. The rep with the biggest gap between raw and required coverage is your first conversation of the week. For the full list of numbers worth a weekly look, see our guide to sales KPIs.
Frequently Asked Questions
What is a good pipeline coverage ratio?
Published benchmarks cluster around 3x to 5x quota: HubSpot cites 3:1 to 5:1 and Salesloft 3x to 5x. Your own target is 1 ÷ your win rate by value, raised for deals that slip. A team winning 25% with 20% slippage needs 5x.
How do you calculate pipeline coverage?
Divide the value of qualified open deals due to close this period by the quota still to close this period. For example, $450,000 of qualified pipeline against $150,000 of quota left is 3.0x coverage. Compare the result with your required coverage, not a fixed rule.
Is 3x pipeline coverage enough?
Only if you win about a third of your pipeline by value and your sales cycle is about as long as the period you measure. With a 25% win rate you need 4x; with a 180-day cycle the total open pipeline you carry is roughly double the quarterly figure.
What is weighted pipeline coverage?
Weighted coverage multiplies each stage's pipeline by the share of deals at that stage that historically closed in the period, adds the results, and divides by quota left. A result of 1.0x or more means the expected bookings cover what's left to close.
When should you measure pipeline coverage?
Weekly, by rep and for the team. Track next quarter's coverage from the first week of the current one, because each deal has to exist about one sales cycle before its close date. With a 90-day cycle, next quarter's pipeline should be built by the day it starts.
Related Posts

What Is a Punch List? How to Run a Punch List Walk
What is a punch list? The meaning, who makes it, what goes on it, a 12-item sample punch list and a faster way to run the walk. Try ParrotNotes free today.

Real Estate Listing Presentation: What to Include and How to Run It
A listing presentation outline you can copy: what to include, how to run the appointment in the seller's home, how to discuss commission and what to note after.

What Is a Nut Graf? How to Write One, With Examples
A nut graf tells readers what a story is about and why it matters now. See where it goes, how to write one, examples and mistakes. Try ParrotNotes free.