
Sales KPIs: What to Track and What to Ignore

Sarah Johnson
Writes about field sales, meeting notes and voice-first workflows at ParrotNotes. Every article is reviewed by the ParrotNotes product team before it goes live.

Table of Contents
- 1.What sales KPIs are, and why most lists are too long
- 2.Leading vs lagging sales KPIs
- 3.The lagging sales KPIs and their formulas
- 4.The leading sales KPIs and their formulas
- 5.Sales KPIs to ignore: seven vanity metrics
- 6.The one-page field sales KPI scorecard
- 7.Where good sales KPIs come from: the record behind the number
- 8.Conclusion
Renee runs eight field reps across two states. Every Monday she opens a dashboard with 27 tiles: calls, emails, visits, meetings booked, pipeline by stage, pipeline by product, logins, and a revenue line that always seems to arrive a month too late. She reads all 27. Then she walks into the pipeline review with no idea which rep needs her help this week.
Her problem isn't a shortage of sales KPIs. It's that most of them describe the past, a few describe effort, and almost none tell her what to do on Monday.
You've probably felt the same pull. Every list of sales KPIs online runs to 20 or 30 items, and every item sounds reasonable. This guide does the harder part. It sorts the KPIs that matter into leading and lagging, gives the formula for each with a worked number, names the vanity metrics to drop, and ends with a one-page scorecard built for a field team you rarely see in action.
If your reps' meetings happen in customers' offices and not on a video call, the scorecard is only as good as the notes behind it. ParrotNotes turns a spoken visit debrief into a summary and next steps, so the numbers start from what was said.
What sales KPIs are, and why most lists are too long
A sales KPI (key performance indicator) is a number you've decided to manage the team by. A sales metric is anything you can count. Every KPI is a metric; most metrics should never become KPIs.
The test is simple. A number earns a place among your sales KPIs when three things are true:
- It connects to revenue. Move it and, sooner or later, closed business moves too.
- Someone can act on it this week. A rep or a manager knows what to do differently when it drops.
- You trust the data. It comes from a record you'd defend in a deal review, not from a form field reps fill in on Friday afternoon.
Most long lists fail the second test. Revenue growth, customer lifetime value, and cost of acquisition matter to the business, but a field manager can't coach a rep on them on Tuesday. They belong on the finance report, not on your weekly page.
Leading vs lagging sales KPIs
The split that makes a KPI list usable is time.
Lagging sales KPIs measure results that have already happened: closed revenue, win rate, quota attainment. They're accurate and they're late. By the time win rate drops, the deals that caused it were lost weeks ago.
Leading sales KPIs measure the conditions that produce results: new qualified pipeline, coverage of the accounts that matter, deals with a real next step. They're early and less certain. That's the trade.
| Leading sales KPIs | Lagging sales KPIs | |
|---|---|---|
| What they measure | Conditions that predict results | Results already booked |
| How fast they move | Days to weeks | Months to quarters |
| What you do with them | Coach and correct now | Judge, forecast and set next targets |
| Review cadence | Weekly | Monthly or quarterly |
| Examples | Target-account coverage, new qualified pipeline, pipeline coverage, next-step rate | Quota attainment, win rate, forecast accuracy, sales cycle length |
Track both. Lagging KPIs tell you whether the leading ones are the right ones. If a rep's leading numbers look healthy for a quarter and the results still don't come, you're measuring the wrong conditions.
The lagging sales KPIs and their formulas
Six lagging KPIs cover almost everything a field sales leader reports upward. The worked numbers below are illustrations, not benchmarks.
| KPI | Formula | Worked example |
|---|---|---|
| Quota attainment | Closed revenue ÷ quota × 100 | $210,000 closed on a $250,000 quota = 84% |
| Win rate | Deals won ÷ (deals won + deals lost) × 100 | 18 won, 42 lost = 18 ÷ 60 = 30% |
| Average deal size | Closed revenue ÷ deals won | $540,000 ÷ 18 = $30,000 |
| Sales cycle length | Total days from opportunity created to close ÷ deals won | 1,440 days ÷ 18 = 80 days |
| Forecast accuracy | 1 − (|actual − forecast| ÷ actual) | Forecast $300,000, closed $270,000: 1 − (30,000 ÷ 270,000) = 88.9% |
| Customer retention rate | Customers kept for the full period ÷ customers at the start × 100 | 186 of 200 accounts still buying = 93% |
A few notes that keep these honest:
- Win rate uses decided deals only. Open deals in the denominator make a rep with a young pipeline look worse than they are. Our win rate calculator shows both win rate and close rate side by side.
- Forecast accuracy needs a fixed snapshot. Score the forecast as it stood in week two of the quarter, not the one that got revised on the last Friday. The full method, with a four-rep example, is in our guide to improving sales forecast accuracy.
- Sales cycle length should be measured on won deals and on lost deals separately. Lost deals that drag for 200 days are a qualification problem, not a speed problem.
The leading sales KPIs and their formulas
Leading KPIs are where you coach. Each one below is something a rep can change between this Monday and next.
| KPI | Formula | Worked example |
|---|---|---|
| Target-account coverage | A and B accounts with a substantive conversation this month ÷ all A and B accounts × 100 | 31 of 40 = 78% |
| New qualified pipeline | Value of opportunities that passed your qualification step this week | Three new opportunities worth $95,000 |
| Pipeline coverage | Open qualified pipeline due this period ÷ remaining quota | $450,000 ÷ $150,000 = 3.0x |
| Stage conversion | Deals that moved from stage A to stage B ÷ deals that entered stage A × 100 | 12 of 20 demos moved to proposal = 60% |
| Next-step rate | Open deals with a buyer-agreed next step and a date ÷ open deals × 100 | 14 of 22 = 64% |
| Stalled deals | Open deals with no stage change for longer than 1.5 times your median time in that stage | 5 deals |
Two of these deserve a closer look.
Pipeline coverage has no universal target. You'll see "3x" quoted everywhere, usually without a source.
Work it out from your own win rate instead. If you win about 30% of your pipeline by value, you need roughly 1 ÷ 0.30, or 3.3 times your remaining quota in qualified pipeline to hit it. A team winning 45% needs about 2.2x. For how stages and exit criteria make "qualified" mean something, see what a sales pipeline is and how its stages work.
Next-step rate is the most useful number most teams don't track. A deal with "went well, will follow up" in the notes isn't moving. A deal where the plant manager agreed to a trial on the 14th is. It's also the leading KPI that most depends on good notes, which is why field teams struggle with it.
Sales velocity ties the two sides together
Sales velocity turns four KPIs into one number: revenue per day.
Sales velocity = (open opportunities × win rate × average deal size) ÷ sales cycle length
With 40 opportunities, a 30% win rate, a $30,000 average deal and an 80-day cycle, the team produces 40 × 0.30 × $30,000 ÷ 80 = $4,500 a day. Raise win rate to 35% and it becomes $5,250. Try your own numbers in the sales velocity calculator to see which lever moves your team most.
Sales KPIs to ignore: seven vanity metrics
A vanity metric is easy to grow, pleasant to report, and loosely tied to revenue. The danger isn't that it's useless. It's that once you set a target on it, reps hit the target and the business doesn't move.
Economists call this Goodhart's law, best known in anthropologist Marilyn Strathern's phrasing: "When a measure becomes a target, it ceases to be a good measure" (the history is summarised in this Journal of Graduate Medical Education editorial).
Tomás learned it the expensive way. His company set a 60-dials-a-day target for its inside team. Within a month, every rep was at 60.
Connect rates fell, because the fastest way to 60 dials is to call numbers you know won't pick up. Pipeline created per rep went down in the same month the dial report turned green. Tomás dropped the target and started reviewing conversations that ended in a next step.
Here are seven metrics to take off the weekly page, and what to track in their place:
| Vanity metric | Why it misleads | Track instead |
|---|---|---|
| Calls or dials made | Rewards effort, easy to inflate | Conversations that ended in a dated next step |
| Emails sent | Sequences send thousands without a reply | Replies from buying contacts, or next-step rate |
| Visits logged | A drive-by counts the same as a real meeting | Target-account coverage |
| Total pipeline value | Includes stale and unqualified deals | Qualified pipeline coverage and stalled deals |
| Meetings booked | Says nothing about what happened in them | Stage conversion from first meeting |
| CRM activities logged | Measures typing, not selling | Next-step rate, checked against the notes |
| Leads generated | Unqualified leads cost rep time | New qualified pipeline |
Activity counts aren't worthless. A sudden drop in a rep's visits can be the first sign of trouble. Keep them as a diagnostic you glance at, not a KPI you manage by.
The one-page field sales KPI scorecard
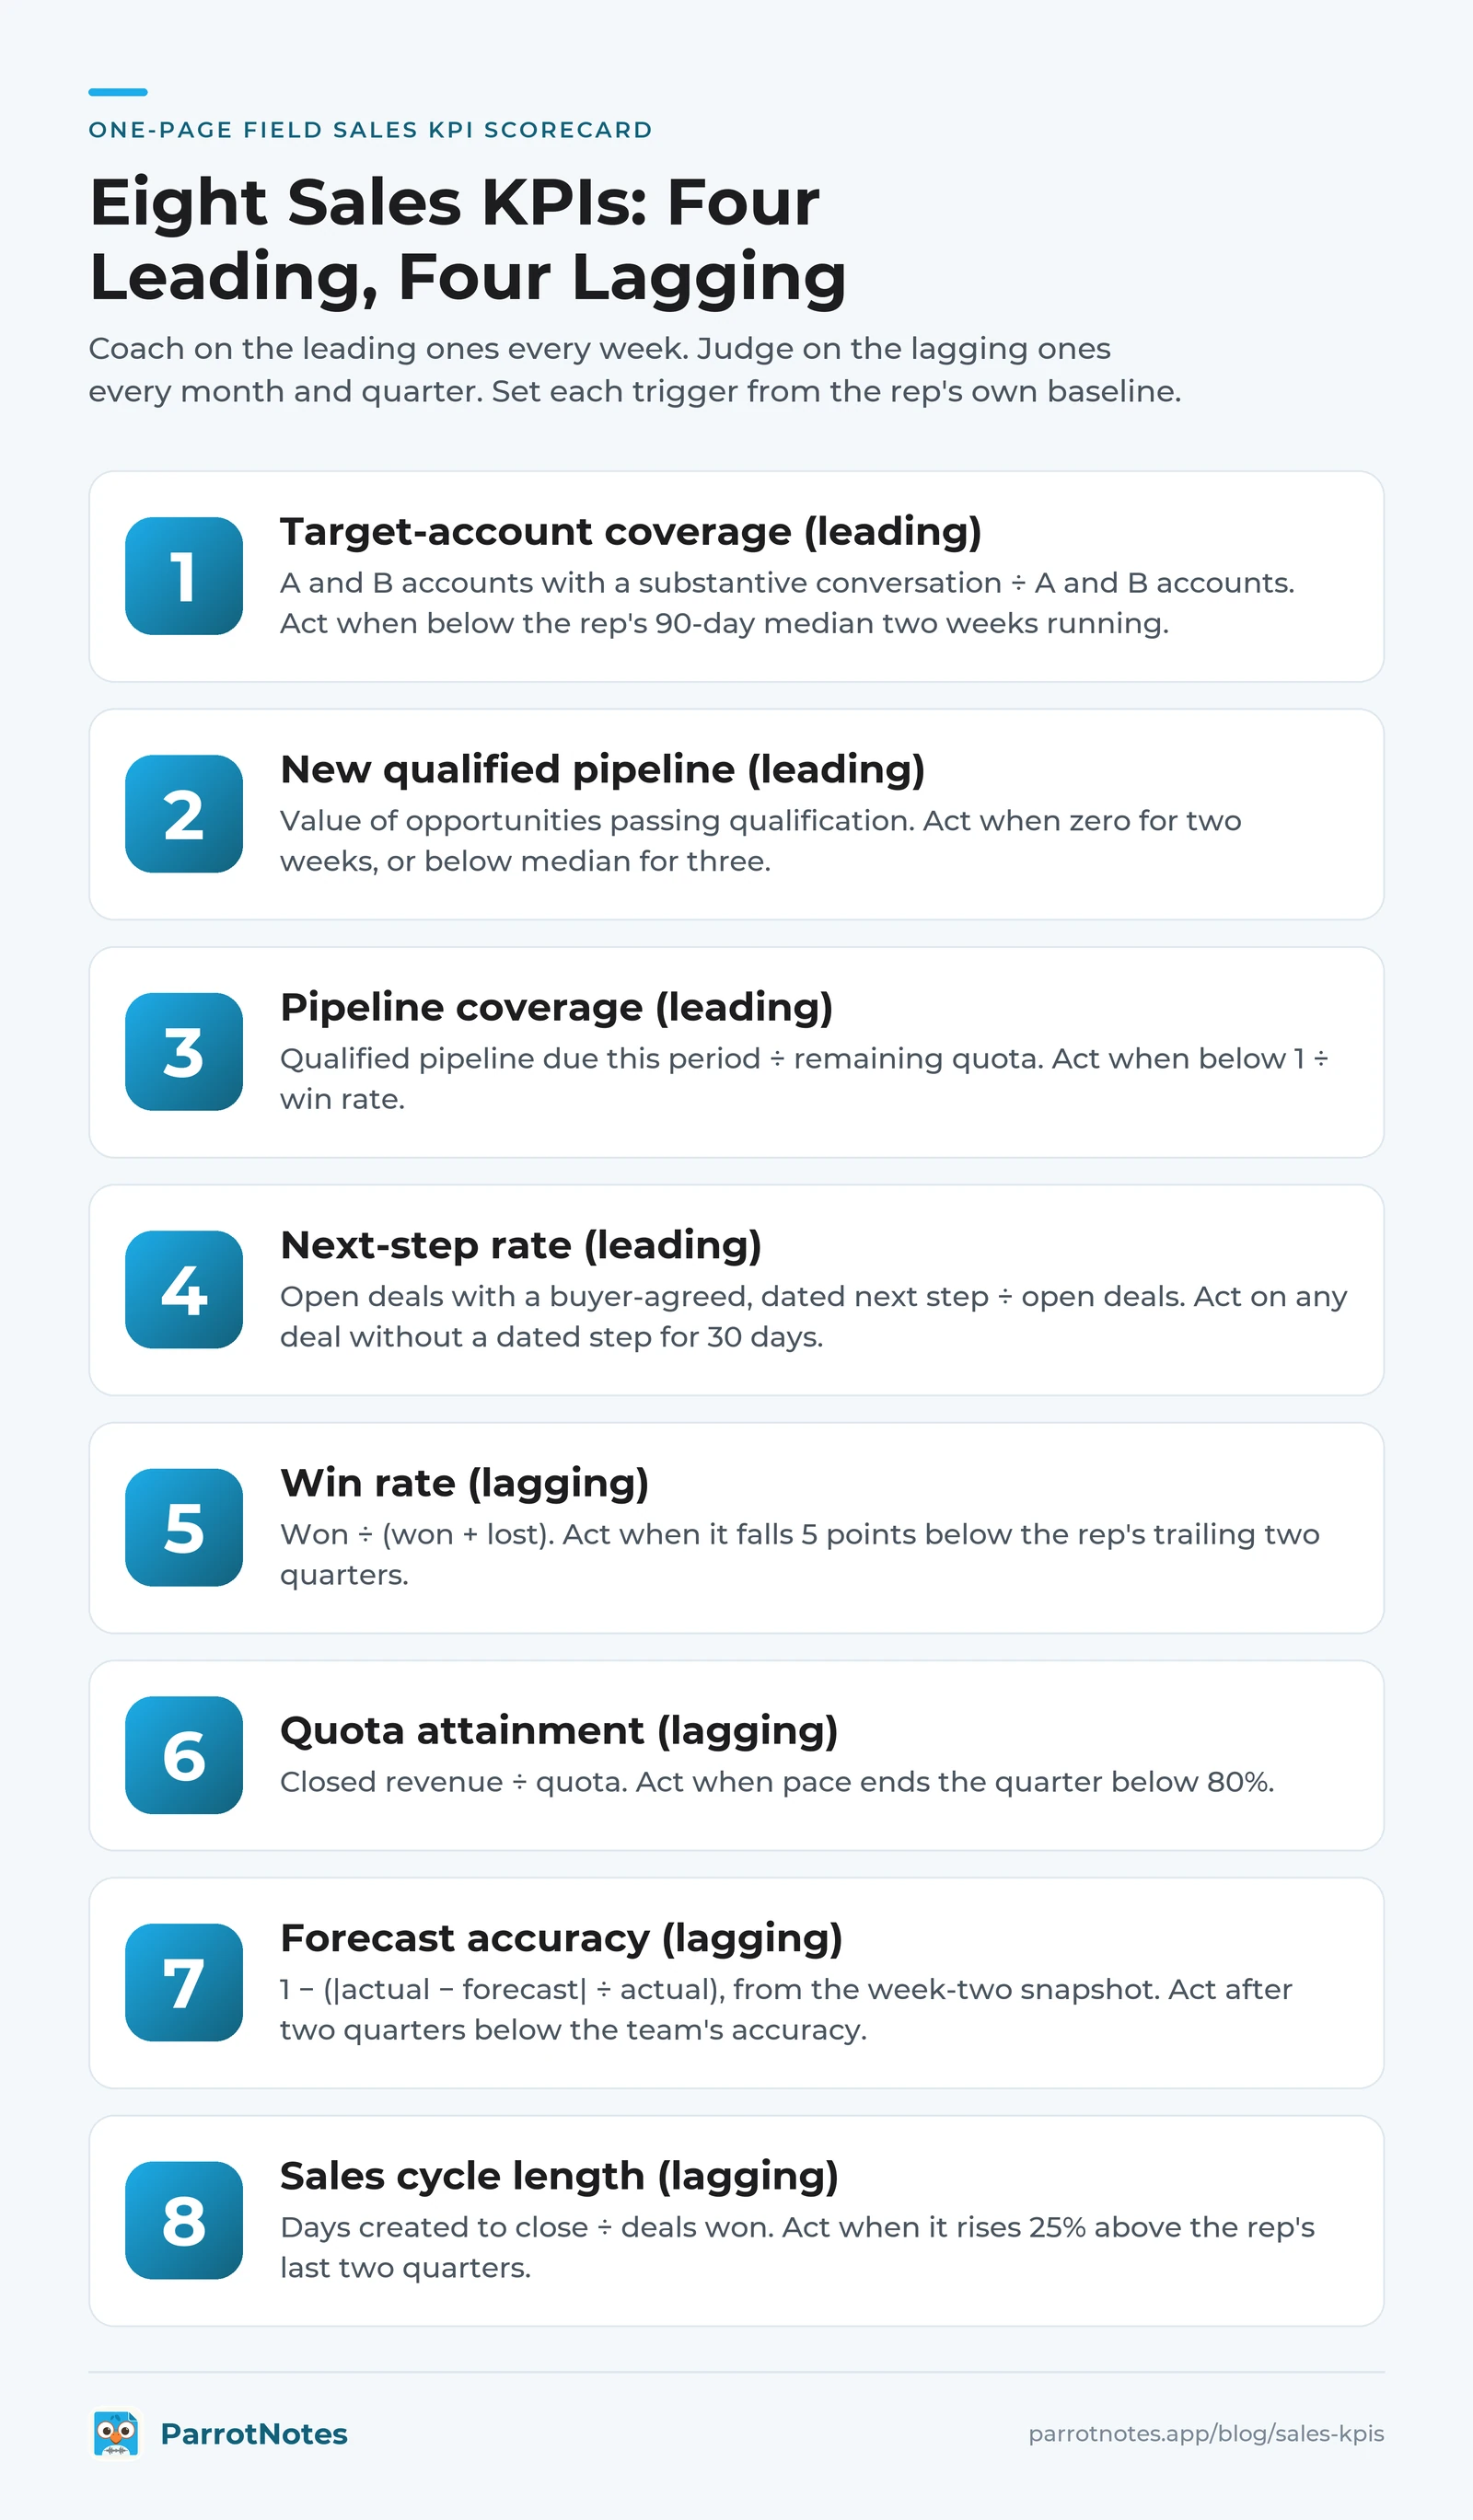
Here's the page Renee could have opened on Monday instead of 27 tiles. Eight sales KPIs, four leading and four lagging, each with a source, a cadence, an owner, and a trigger that says when to act. The triggers use each rep's own baseline, because territories, products, and cycle lengths vary too much for a borrowed benchmark.
| # | KPI | Type | Formula | Source | Review | Owner | Act when |
|---|---|---|---|---|---|---|---|
| 1 | Target-account coverage | Leading | A and B accounts with a substantive conversation ÷ A and B accounts | Visit records, account list | Weekly | Rep | Below the rep's 90-day median two weeks running |
| 2 | New qualified pipeline | Leading | Value of opportunities passing qualification | CRM, qualification notes | Weekly | Rep | Zero for two weeks, or below median for three |
| 3 | Pipeline coverage | Leading | Qualified pipeline due this period ÷ remaining quota | CRM | Weekly | Manager | Below 1 ÷ win rate |
| 4 | Next-step rate | Leading | Open deals with a buyer-agreed, dated next step ÷ open deals | Visit notes, CRM | Weekly | Rep | Any deal without a dated step for 30 days |
| 5 | Win rate | Lagging | Won ÷ (won + lost) | CRM | Monthly | Manager | Falls 5 points below the rep's trailing two quarters |
| 6 | Quota attainment | Lagging | Closed revenue ÷ quota | CRM, finance | Monthly | Manager | Pace ends the quarter below 80% |
| 7 | Forecast accuracy | Lagging | 1 − (|actual − forecast| ÷ actual) | Week-two snapshot | Quarterly | Manager | Two quarters below the team's accuracy |
| 8 | Sales cycle length | Lagging | Days created to close ÷ deals won | CRM | Quarterly | Manager | Rises 25% above the rep's last two quarters |
The trigger thresholds are starting suggestions, not industry standards. After a quarter, tighten or loosen them to match what your team does.
A worked week (fictional example)
It's the second Monday of the quarter. Renee's scorecard flags three things across eight reps:
- Aisha: target-account coverage dropped to 55% against her median of 80%. Her pipeline still looks full, so the dashboard wouldn't have caught it. Renee asks which A accounts she hasn't seen and why. A key account changed buyers, and Aisha has been waiting for an introduction.
- Dev: next-step rate is 40%. Nine of his 15 open deals have no dated step. Renee spends their one-on-one going deal by deal and asking, "What did the buyer agree to do next?"
- The team: pipeline coverage sits at 2.6x against a 3.3x need (win rate 30%). That becomes the first item on Friday's sales meeting agenda: where the missing $840,000 of qualified pipeline comes from, on $1.2 million of remaining quota.
Nothing else needs her attention this week. That's the point of a one-page scorecard. The other five reps are green, and she spends her time where the leading numbers say it matters.
For the weekly rhythm around this page and territory design, see our guide to field sales management. For the rep's own view of their time, see sales rep productivity.
Where good sales KPIs come from: the record behind the number
All four leading KPIs on the scorecard depend on what was said in a meeting: which accounts got a real conversation, whether a deal passed qualification, and what the buyer agreed to do next. In an inside team, that conversation is often already on a recorded call. In a field team, it happened in a customer's office, and it reaches the CRM when the rep finds time to type it.
Time is tight. Salesforce's State of Sales report, a survey of 4,050 sales professionals published in February 2026, found that the average seller spends 40% of their time selling, and that 46% rarely get feedback on their sales conversations. When the notes arrive days late and thin, the leading KPIs turn into guesswork, and so does the coaching built on them.
Consider Owen, a fictional rep selling packaging equipment. After a plant visit, he records a two-minute debrief in the car: who was in the room, the problem they named, the trial date the engineer agreed to. ParrotNotes turns it into a summary with action items and a draft follow-up email before he reaches the next stop. When Renee checks next-step rate on Friday, the date in the CRM matches what the engineer said on Tuesday.
That's the practical case for capturing the conversation. ParrotNotes records on the phone your reps already carry, with no meeting bot. On Pro it structures notes against sales frameworks such as BANT, MEDDIC, and SPIN, so the qualification evidence behind "new qualified pipeline" is written down the same day. If you're weighing tools for the coaching side, our buyer's guide to sales coaching software covers what to look for.
Try ParrotNotes free on your next ride-along and see what a same-day debrief does to your next-step rate.
Conclusion
Good sales KPIs are a short list you act on, not a wall you read. Sort them into leading and lagging.
Coach on the leading ones every week: target-account coverage, new qualified pipeline, pipeline coverage, and next-step rate. Judge on the lagging ones every month and quarter: win rate, quota attainment, forecast accuracy, and cycle length.
Drop the vanity metrics from the weekly page, because a target on dials or emails gets you dials and emails.
Then fix the record underneath. For a field team, half the scorecard depends on what was said in a customer's office, and that detail fades by Friday.
Copy the one-page scorecard, set each trigger from your own 90-day baseline, and run it for a quarter. When you want the notes behind it captured the same day, download ParrotNotes free and have your reps try a two-minute debrief after their next visit.
Frequently Asked Questions
What are the most important sales KPIs?
For a field team, start with eight: target-account coverage, new qualified pipeline, pipeline coverage, and next-step rate as leading KPIs, and win rate, quota attainment, forecast accuracy, and sales cycle length as lagging KPIs. Leading KPIs tell you where to coach this week. Lagging KPIs confirm whether the coaching worked. Add more only when one of these can't answer a question you keep asking.
What is the difference between leading and lagging sales KPIs?
Leading sales KPIs measure conditions that predict results, such as qualified pipeline created or deals with a dated next step. They move within days and you can act on them. Lagging sales KPIs measure results already booked, such as win rate and quota attainment. They're accurate but late, so use them to judge and set targets, and use leading KPIs to steer.
How many sales KPIs should a team track?
Fewer than most dashboards show. A manager can act on six to ten numbers a week; beyond that, reviews turn into reading tiles. The scorecard in this guide uses eight. Keep other metrics available as diagnostics you look at when a KPI flags a problem, but don't set targets on them or review them every week.
Are activity metrics like calls and visits bad KPIs?
They're poor targets and useful diagnostics. When calls or visits become a target, reps hit the number by making easier calls and shorter visits, and revenue doesn't follow. Track the outcome instead: conversations that end in a dated next step, or target-account coverage. Glance at raw activity when a rep's leading KPIs drop, because a sudden fall can explain why.
How do you set targets for sales KPIs without benchmarks?
Use your own history. Measure each KPI for 90 days, take each rep's median, and set the first target slightly above it. For pipeline coverage, divide one by your win rate by value: a 30% win rate needs about 3.3x coverage. Published benchmarks rarely match your territory, product, or sales cycle, and many are quoted without a source.
Related Posts

Voice Journal App: How to Keep a Spoken Work Journal
Use a voice journal app to keep a spoken work journal: a 3-minute daily prompt set, a 20-minute weekly review, and what to look for in the app. Start today.

Sales Territory Management: A Field Rep's Playbook
Sales territory management for the rep who runs one: a one-row-per-account ledger, visit cadence by tier, and a 40-minute Friday review. Get the template.

Quote Follow-Up Email: What to Say After You Send the Quote
Quote follow-up email templates for RFQ quotes: a day 1 to day 30 sequence and what to say on price, a revised quote, expiry, and a lost bid. Copy and send.